Author
Enrique Rodriguez
The ability to monitor servers and applications is a key skill for any software development provider: it’s important to include it within the range of services we offer our clients, but it’s just as important for our own internal use.
As ever, selecting the right tool for each task represents one of the most important elements for any successful software development project. And, in this case, we felt the need to develop our own flexible monitoring tool, made up of several different elements.
In this article, we explain why we took up the challenge of developing our own monitoring solution, how we chose each of the tools that we are using, and how we made all the tools work together.
Our motivation
Monitoring is a peculiar task, because it’s by no means as generic and repetitive in different situations, as one might think. It has to deal with the challenges presented by different hardware, contrasting operating systems, applications created using diverse technologies, and so on. But that’s not all it has to deal with: different customers might be interested in monitoring different data, and might also want different analyses to be derived from that data.
The configuration process also needs to be very intuitive, because once a monitoring solution is installed, it’s going to be maintained by administrators, not developers. That’s why a monitoring tool also needs to take into account user experience. Needless to say, installing and configuring monitoring tools is something you have to do regularly, so implementation needs to be really quick and easy.
There are plenty of solutions already out there, that are very stable and reliable. However, this number reduces significantly, if you only consider the open source options and take into account all the challenges, mentioned above, that need to be tackled.
As a result, we decided it would be worth creating our own tool, in order to investigate just how far a monitoring tool can go, in terms of its flexibility, following the open source principles.
The requirements
We wanted to:
- Select which hosts to monitor; and be able to start and stop monitoring, on demand
- Configure which metrics to monitor in each host, dynamically
- Configure collection frequency for each metric, independently
- Save all information collected for analysis, later
- Configure alerts to notify people when some condition is met regarding a metric
The Architecture
In the following sections we’re going to give a high level description of how our solution was designed and implemented. If you want to read this in greater detail, you can find the source code in github.
Based on our requirements, we chose a fairly typical architecture for a monitoring solution. The architecture we chose is built on two base entities: Agent and Principal.
Agent
One agent is installed in each host we want to monitor. Agents provide us access to all kinds of metrics from within the machine.
As we want to configure which metric we want to collect on each host, dynamically, it would be awkward if we had to deploy, modify configuration files, restart, or edit something directly in the monitored host. As such, we designed agents so they can change their behavior in runtime. They are even able to start collecting completely new metrics, without us having to change their code.
Once installed, agents open a communication channel, via which only a principal can send instructions. These instructions tell the agent which metrics to collect and how often. Then, each agent periodically gathers these values and reports them back to their principal.
In summary, agents do the following:
- Run on monitored hosts
- Dynamically load collection strategies
- Receive and react to directives from their principal
- Gather information and send it to their principal
Principal
There is one principal per agent (meaning one principal per monitored host). Each principal is responsible for the interaction with a single agent. To start with, all the principals can be run from one machine, but we should implement principals in a scalable way, so that their number can grow indefinitely, which we can support with horizontal scaling.
For example, when we want to start collecting a new metric in a host, or configure an alert for when a metric is above a certain value, we tell the corresponding principal. The principal takes care of everything required: communicating the changes to the agent, and saving the newly created configuration (just to persist between system restarts). In order to do this, we use a REST interface so that we can configure every host, metric and alert.
Interactions with the agent include receiving the metrics that have been collected, so it is important to note that the communication between agent and principal flows in both directions.
All the information received from the agent is immediately saved into a reliable database, that has to be able to cope with several principals sending multiples metrics and also has to respond quickly to complex queries for real-time analytics.
In addition, as new metrics arrive, the principal monitors alert configurations and checks to see if any conditions are met, in which case the principal notifies the relevant parties.
So a principal’s work includes:
- Notifying their agent to start or stop collecting metrics
- Saving the host configurations, both metrics and alerts
- Reading and saving all metrics received from their agent
- Monitoring to see if a metric condition has been met and alerting the relevant parties
Visualization
Collected data is meant to be analyzed. For this, we have to provide a visualization tool that can help users not only query, but also visualize in a meaningful way, the data that is being collected. Basically, we need an application that can display charts for custom queries and create dashboards.
Implementation
Akka
Given the communication requirements between agents and principals, and need for simple scalability if we want to run a lot of principals, we chose the Akka framework to implement our requirements. Akka-remote provides a transparent communication API that helps to keep the amount of code to a minimum. Also, with Akka we can add more hardware resources to run the principals, while keeping the code untouched.
Akka implements the actor model and it’s easy to map our reality to actors. That’s why, until now in this post, we have treated agents and principals as people, because we can directly model them as actors, and we refer to them as such.
However, those aren’t the only actors we use in our implementation: agents spawn their own subordinates, called collectors, for instance – these are the actual units used for metric collection. Each collector collects one metric with a given frequency. On the principal’s side, we also have Watchers, who are responsible for comparing metrics being collected with the configured alerts.
Now let’s see a more detailed description of how the system works, by looking at configuring a new host for the first time, called “Host A”.
After installing the agent software in Host A, we have to register it in our configuration store. To do that, we use the configuration service. We call the REST interface, giving the host’s name. The system will react to that by saving the configuration into the store and also by creating a new principal actor. The principal will be responsible for communication with Host A. This process is shown in figure 1. Notice that saving configuration and creating the principal are two processes that run in parallel, and that’s why they are both numbered starting at 3.

- Figure 1

When a principal initiates, it sends a message to the configuration store, asking for the metrics to collect in Host A. There might already be metrics configured for this host, as this process happens after a system restart; or, it might be the case that we previously stopped collecting from Host A and now we want to start, again. In any case, the principal will connect to Host A via Akka-remote and tell the remote system to create a new agent actor, with the given configuration. The system in the remote host will respond with a reference to the newly created actor, for further communication. This flow is represented in figure 2.

- Figure 2

When the agent initiates, he calls the actor system to create one collector actor per metric to be collected. Then, each collector dynamically loads the collection strategy and schedules it for execution with the required frequency. Later on, other metrics can be configured and more collectors will be created, as a result.
As shown in figure 3, when the collection strategy is finally triggered, the value collected is sent back to the principal and saved into the metrics store.

- Figure 3
Dynamic class loading
In order to achieve the goal of changing the metrics being collected in runtime – without any downtime – collectors can dynamically load compiled classes. In this way, the strategy of collecting a new metric can be developed independently, dropped into a lib folder and loaded, without restarting anything. In addition to this extensibility-focused feature, we have also included a selection of basic metrics to be collected, such as: CPU, memory and disk usage. These depend on Sigar library, which includes native libraries that specifically deal with the details of the operating system and hardware.
Task scheduling
Task scheduling is managed by Akka. This is a very handy feature, letting us schedule recurring tasks with very little effort. Collectors schedule metric collection with a given frequency within the Akka framework. What they actually do, in reality, is tell the framework to periodically notify themselves, using a predefined message. When collectors receive this message, they fire up the collection strategy.
Time series database
When you look at the data being collected, it follows a pattern. All kind of metrics have a timestamp (the moment when the metric was collected) and a corresponding value for that timestamp. The value is typically numeric. So what we need is what is commonly called a Time series database (TSDB). For this task we chose InfluxDB, a very promising TSDB implementation, with a simple to use API.
InfluxDB has no external dependencies, so it’s pretty easy to install and maintain. It also provides a very useful HTTP API which is straightforward and allows us to execute queries and write data. At present, there isn’t a Scala library to write and read from InfluxDB 0.9 (the latest, stable version), but given that the HTTP API so simple, we made it work using scalaj-http.
REST service for configuration
In order to configure the different hosts with their different metrics, we provide a REST interface, servicing operations to manage the three basic resources: hosts, metrics and alerts.
Creating a host resource translates into instantiating an agent in the corresponding host. Deleting the host resource means that we stop collecting all metrics and kill the agent, along with all of their collectors. These two operations are independent from the agent software being installed on the host. This software is an extremely lightweight process, that just listens on the Akka-remote port and instantiates an agent, if needed.
Below the host resource, following the REST protocol, we expose metrics and alerts. Creating or deleting metrics means starting or stopping metric collection in the host. The same applies for alerts; you create an alert resource to start monitoring a metric’s value, or delete an alert resource, to stop watching it.
In this case, we chose Spray, which smoothly integrates with Scala and Akka, allowing us to define the REST services cohesively with our actor system.
Persistence of configuration
The hosts and their configuration need to be saved somewhere, so that they aren’t lost between system restarts. We chose to use one of our favorite databases: redis. Redis is not only blazingly fast, but also provides useful data structures that help us reduce the effort needed to manage our data.
Alerts
Although more types of alert can be added, for now, what we need is simply to send emails. Scala is relatively new, but it already has plenty of community contributions and there are libraries that cover almost any requirement you might have. There’s a library called courier, that covers emailing. We chose to use courier because of its simplicity and stability.
Visualization
In order to display the InfluxDB data in charts, organized in dashboards, we found no better tool than Grafana. Grafana has an elegant and intuitive user interface. It integrates with InfluxDB, allows us to write the custom queries that we want to display, and mix charts with different data sources.
Here’s a screenshot of a dashboard we created for a server that runs a Jenkins instance:
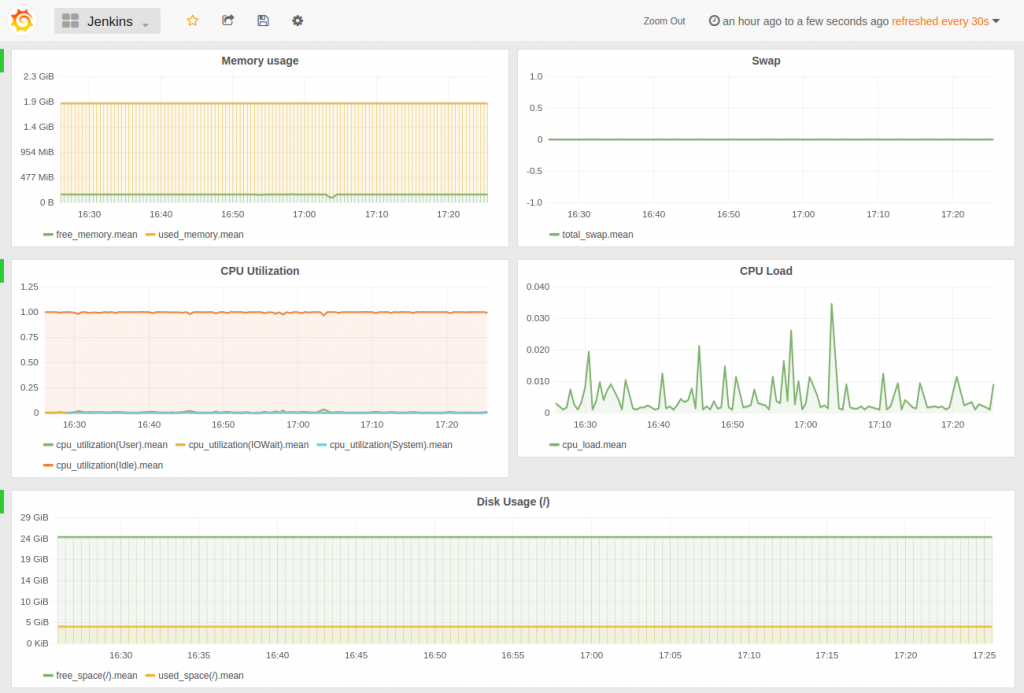
- Figure 4

Building and packaging
It’s worth noting that the packaging process was tremendously simplified thanks to sbt-native-packager. Simply by configuring the desired options within sbt, you can then generate rpm and deb packages with a single command. These packages, once installed, configure a process to be run as a system service and generate all the necessary directory structure for binaries, configuration and logging, conforming to Unix standards.
Testing
As with any other project, our tool needs to incorporate automated tests. In the Scala world, you can choose between a couple of frameworks; we found Scalatest useful for this task. However, Akka actors require some infrastructure that can’t be easily created on the fly, without some help from the framework. That’s why we added the Akka-testkit to our test suites, which meant that we could finally cover every aspect of our code.
Conclusions and future work
Any monitoring tool needs to be designed to tackle multiple, diverse problems, and that makes it an interesting subject of study. We started by selecting the main tasks required to create a minimum viable product; we then designed a high-level architecture; and tailored it to our specific implementation. It’s still a work in progress, and more work is required to make it a complete product. For example: creating a UI for the host configuration that focuses more on UX; improving the flexibility of alert configurations; creating new alert channels, other than email; and defining failure management, should an agent ever fail.
Akka is a modern framework that, when combined with Scala, resulted in a small and manageable code base, letting us focus on the monitoring problems rather than technology-related ones. Besides that, tools like InfluxDB, Redis and Grafana were integrated, in order to create a robust overall solution, based on great tools, each of which is focused on completing specific tasks.